
PowerNAP by: Tyler Piteo-Tarpy
Seattle’s pet licenses dataset is made up of the Seattle Animal Shelter’s collection of license issue dates, license numbers, pet species, primary and secondary breeds, and ZIP codes. There are a total of 46,062 currently registered pets in Seattle, 31,893 dogs (69%), 14,134 cats (31%), 31 goats, and 4 pigs. Either Seattleites are twice as fond of dogs as cats, or they are just twice as likely to register them.
The most common primary breed of pet is the Domestic Shorthair cat, with 7,920 of them making up 56% of all the cats. The second most common primary breed is the Labrador Retriever dog, and 3,785 of them make up just 12% of all the dogs, meaning that pet cats have far less primary breed diversity. In total, there are 334 different primary breeds of pets represented, with an average of 138 pets per primary breed.
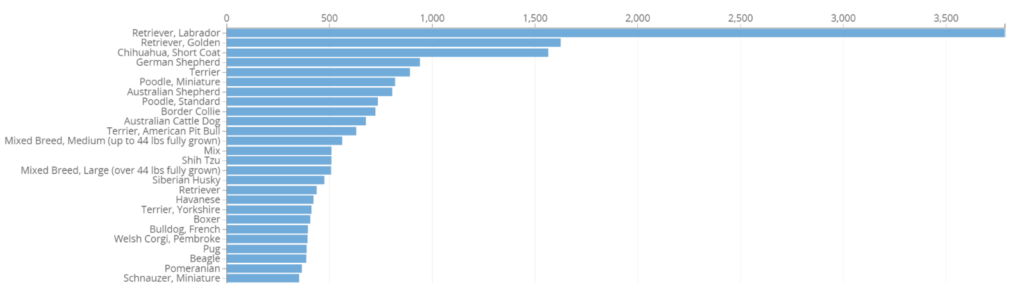
(26 most common primary dog breeds)
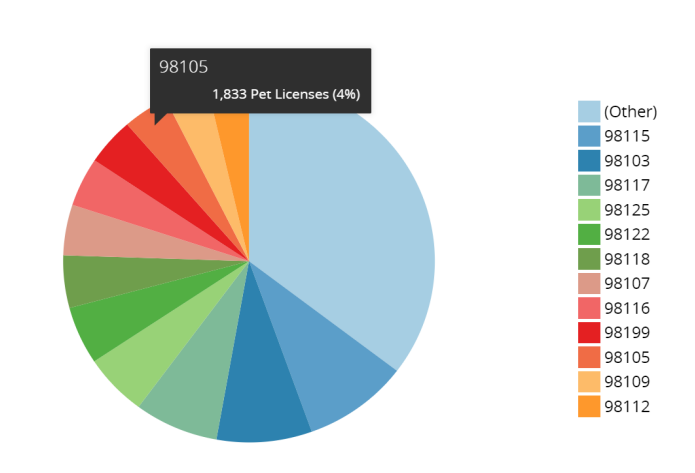
Looking at ZIP codes, the area with the most pets is 98115 at 4,226 pets, 9% of the total. 98105, one region South, where the University of Washington campus is present, has the 10th highest number of pets.
(12 ZIP codes with the most pets)
1
Of the top 50 most common names, none are species exclusive, though Cooper, Murphy, and Daisy are especially skewed towards dogs (91%, 91%, and 89%) and Loki is somewhat skewed towards cats (37%), based on their proportion in the sample. Additionally, 3 goats made it onto this list with one each being named Coco, Finn, and Teddy.
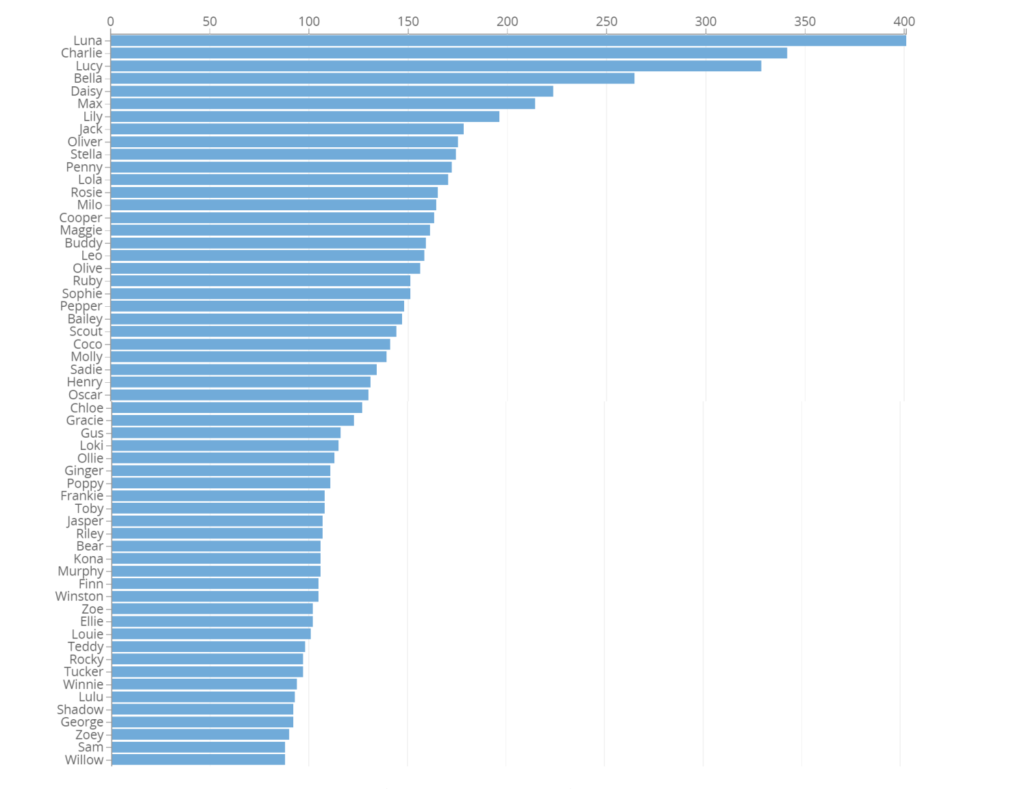
(50 most common names)
The graphs below show the change in licensing rates over time. Though the dataset was created in January 2017, there is very little data until October 2019 when the licensing rate per month rises from 23 to 782. The rate continued to rise rapidly until January 2020, then flattened until another rise from October 2020 to January 2021. This pattern did not repeat again, however, as October 2021 saw a large drop from 2,475 to 681. The yearly graph shows that in 2018, 52 licenses were issued, in 2019, 3,441, in 2020, 18,922, and in 2021, 23,634 so far.
2
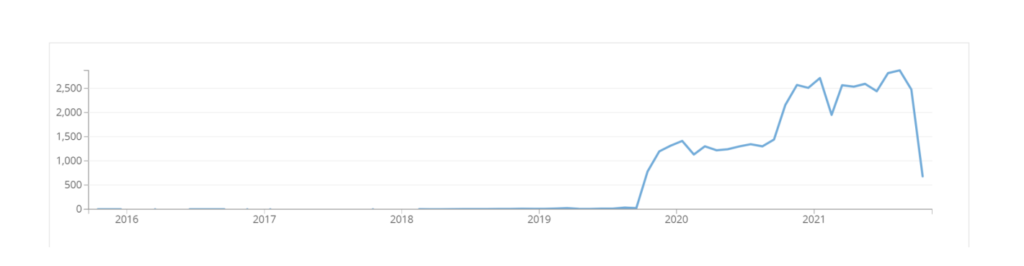
(Monthly licensing rate)
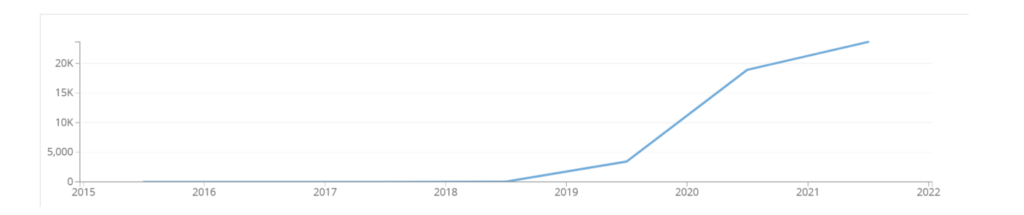
(Yearly licensing rate)
Finally, dogs, representing over two thirds of the sample size, set the general licensing rate trends, as shown by the similarity between the general licensing rate graph and the dog specific graph. Cats, while also following the same general pattern, have more dramatic peaks and drops, indicating that cat licensing is somewhat more seasonal.
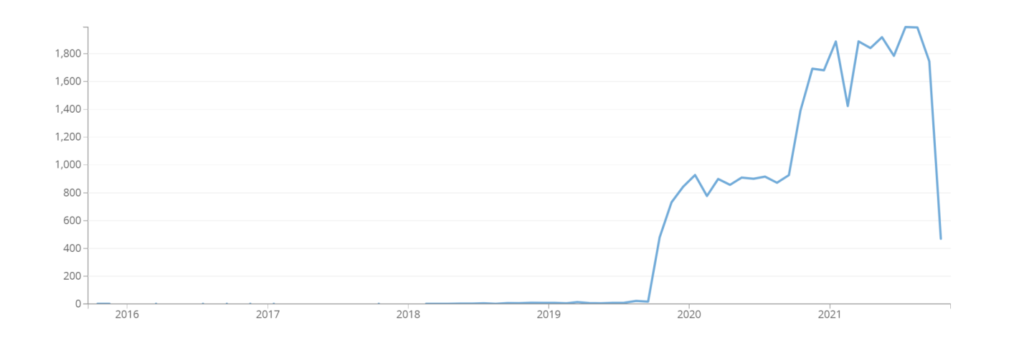
(Monthly licensing rate for dogs)
3
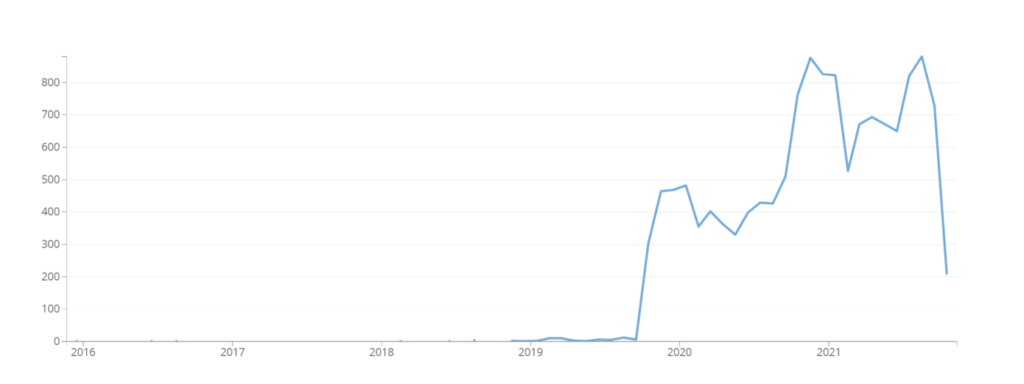
(Monthly licensing rate for cats)
4